Representative End User Clients







Representative Automation Clients







Representative Software Clients









Industrial facilities collect lots and lots of data, both from the sensors connected to the control system and other sources, including edge devices in the plant and remote devices in the cloud. While there can be “gold” in all that data, it can also turn into lead if not properly collected, validated, analyzed, and visualized. Data quality is particularly important. Most people would be surprised to learn how easy it is to collect bad data without knowing it. This ARC Insight reviews some best practices in this area.
When the first digital control systems were developed, it became apparent that digital controllers required data with a known quality status. This is because controllers acting on bad data could lead to costly and often perilous process upsets. DCS developers embedded the quality information side by side with the data as a quality status to enable the controller to know when a measured value was invalid and act accordingly. For example, standard PID controller behavior is to go to HOLD or MANUAL if the measurement is invalid for any reason.
However, with many control systems, it’s difficult to view the data status, making it all too common to forget about the data status when collecting data in a real-time historian or when using that data in a calculation. Without knowing the difference between valid and invalid historical data, decisions made or actions taken on that data could be flawed.
The time factor is also important, specifically the sampling frequency and the timestamping of data. The I/O system involved with industrial manufacturing gathers sensor data with sample rates typically in the one millisecond to 25 millisecond range. Real-time control systems can gather data asynchronously from the I/O sub-system, often with some averaging and signal conditioning involved. The controller typically samples all inputs, executes all control algorithms, and writes all outputs in a fixed control cycle. Modern control systems typically operate at between 10 and 1,000 milliseconds, although some functions can be faster or slower.
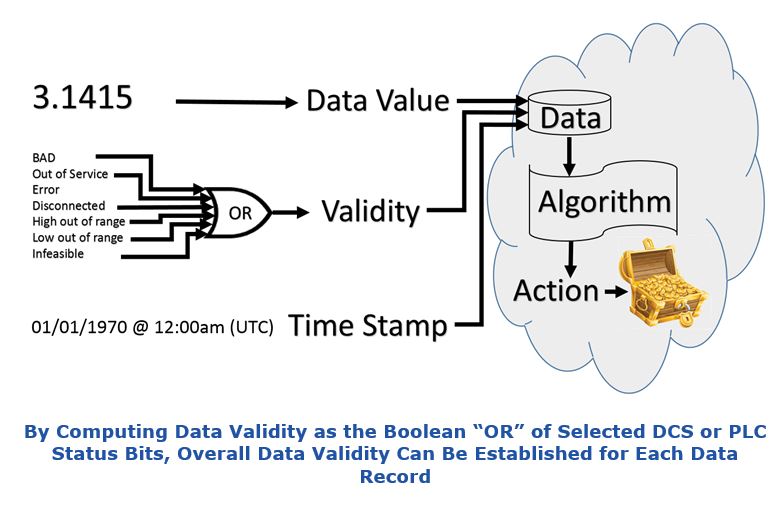
Some data acquisition and control systems timestamp every unique data value. In the manufacturing industry, sample rate for data in a historian is roughly an order of magnitude slower than the controller cycle. Scan times for data collection are commonly between one and 60 seconds. In the typical configuration, the data historian collects the data at a constant time interval and internally timestamps the data when collected. For many data analytics applications the I/O and control system delays are so small they can be ignored.
The sampling interval for the data historian must be matched to the needs of the data analytics application. A classic problem is “data aliasing.” Slowly taking regular samples of an oscillating waveform (like a sine wave) results in recording a harmonic. This obscures the actual oscillation. As a rule, it’s necessary to sample at least 10 times faster than the time constant of interest in the data analytics application. Research data loggers may need to sample data much faster than typical industrial historians. Sequence of events (SOE) recorders need to sample in the one millisecond range and accurately timestamp events collected by multiple sensors.
In instances where data might be collected from multiple sources with transmission delays, the sensor data can be timestamped at the moment the measurement is made to ensure accurate time synchronization.
In some cases, I/O systems compute a running average of several samples and the control systems collect this averaged value. A common practice is to filter noisy analog data with a first order lag or similar filter in the control system. In most cases, these digital data manipulations are not harmful, but care should be taken to understand how the data gets from the sensor to the historian to make sure it remains useful.
The Industrial IoT (IIoT) promises even more data coming from new sensors and often from suppliers that are not familiar with the industrial space. While these sensors can feed new data analytics applications, the industry has not yet established a common standard for how IIoT data is collected, conditioned, and communicated. Google is pushing “Thread”, Qualcomm is behind the open source “AllJoyn,” and Intel is pushing the Open Interconnect Consortium. It is likely that emerging IIoT standards will include metadata such as quality status information and timestamping and this may distinguish Industrial IoT from simple IoT data from sensors.
DCS and PLC suppliers all recognize the need to handle quality status and timestamping but each supplier solves this problem in its own way within their architecture. Combining IIoT data and traditional industrial historian data can be problematic as the pedigree of the data can vary widely and depends on the communication architecture. Data quality status needs to be built into the sensor, signal conditioning, and communications technology that moves the data from the sensor into applications like a data historian. A useful approach is to define each data record as either VALID or INVALID by inspecting all the data validity information. If the status is “BAD”, “OUT OF SERVICE”, “ERROR”, “HIGH OUT OF RANGE”, “LOW OUT OF RANGE” or “I/O BLOCK IN MANUAL” or any other fatal error, the data should be marked as “INVALID”.
Anyone looking at historical data is likely to ask, “What was really going on in my process?” during a time period of interest. This requires uniform collection of valid sensor data, plus contextual information that allows sensor and operational data to be sorted. Processes have modes of operation like starting, normal operation, production grade, grade transition, calibrating, stopping, and shutdown. It is very helpful to compute the context in the control system and record it as part of the data. The context is like a treasure map that shows data analysts where to look for the gold.
There are many reasons why it’s so challenging to collect and record only good data in a timely fashion in real-world process control situations.
A raw analog signal could be 0-10VDC or perhaps 4-20 mA. It has no quality information, just the raw data. This data enters the digital world at the A/D converter. It pays to keep your eyes on the data as it travels from the sensor to the data analytics application. The A/D converter converts the analog signal to an integer with a resolution based on the number of bits. Twelve bits has 2^12 values (one part in 4096), where 16 bits has 65535 unique values. As A/D’s operate fast, the control system could actually be receiving the averages of several A/D conversions.
I/O devices can also perform various signal-conditioning computations. One example is converting the millivolts of a thermocouple to temperature based on curves that apply to the thermocouple type. Data values may be reformatted from integer to floating point. The data repository may receive an average of conditioned sensor values for several control system scans. Some applications require unfiltered samples, while others can use averages. From a networking perspective, the I/O device typically communicates with the control system over some type of fieldbus network and the control system may communicate with the data repository via serial link, wireless technology, or Ethernet; possibly with multiple interfaces involved. The digital data stream works with messages, so the data can be reformulated, averaged, limited, and possibly timestamped depending on the messaging format.
The control system vendor or third party could provide the data repository itself. The database structure varies widely, as streaming real-time data is not well-suited to the more popular relational databases. Real-time data can accumulate at incredible speeds and the data collection architecture and protocols may not be structured in a way such that each data value has an associated quality status and timestamp in the repository.
Many historian applications or communications systems only record data when a change threshold is exceeded. Thresholds set to zero collect the same data on every scan cycle, but can consume excessive bandwidth. Thresholds set too high can limit the data resolution.
If a communication link is broken, the receiving end of the data may not record any new values and, instead, just hold on to the last good value. This could give the impression that control is rock steady, which might not be the case. Some architectures can buffer data locally and fill in missing data when the link is restored.
Configuring data collection at a data historian looks simple. Just specify a tag name, collection frequency, and measuring scale with engineering units. Completely missing is how the quality status or timestamp is handled and this depends on the specific system configuration and your data collection strategy. The timestamp can be less problematic, since subsystems are often so fast that the error due to the time interval required to record the measurement of the physical state at the sensor in the data repository is inconsequential.
Some DCS historians handle the data validity seamlessly, but third-party historians require some attention. All widely used, third-party real-time historians support fields for data validity and timestamping, but these data fields are not always populated. Quality flags and data timestamping are supported over many different networks and communications protocols, but this behavior must be configured into a supportive architecture.
OPC, OPC UA (Unified Architecture), serial links (Modbus for example), and MQTT (Message Queuing Telemetry Transport) are widely used to move real-time data between different proprietary systems. All these architectures and protocols support metadata such as quality flags and timestamps, but users don’t always implement these metadata. If necessary, the quality and the timestamp of the data can be transmitted to the data historian as separate data value records. Of course, this will create more historian tags and each tag will require configuration.
Some additional complications occur with manually entered data like lab samples.
In one real-world example, an operator in a refinery was supposed to take a 6:00 am sample every day and send it to the lab for analysis. But since that happened to be near the end of the shift, he took his samples at midnight instead, incorrectly recording the data as a 6:00 am sample. A data analyst building a regression model from this historical data was trying to find the relationship of temperature, pressure, and flow data of a distillation column to the purity measured by the lab. Because the lab data could be shifted by six hours and was recorded inconsistently by different operators, the bad data corrupted the results. The resulting models could have been better.
Another problem occurs when sensors are not accurate or there are problems with scaling, signal conditioning, or engineering units. Redundant measurements of the same variable will likely indicate different values. But with three measurements, you can choose the median value, which should be reasonably useful.
Flowmeters are sometimes installed to meter all inflows and outflows from a tank or a unit operation. However, even when all streams are metered, there are no leaks in the process, and the unit operation is not accumulating material, the mass entering does not always equal the mass leaving. In this situation, one or more of the meters is inaccurate, as mass is known to be conserved. If a data analyst makes a computation based on the sum of the inflows, it will differ from another calculation based on the sum of the outflows. This error can be resolved by material balance reconciliation by applying a correction factor to all the flow measurements. Although not a substitute for accurately calibrated meters, this is standard practice to prepare data for on-line optimization calculations.
In another example, an environmental engineer may prepare an environmental compliance report based on historical data. The report may have rolling averages and other calculations based on the data from the repository. Various sensors like pH or stack gas sensors require periodic calibration and operators can put the analog input function block in MANUAL mode to avoid alarms or controller actions. Reports need to identify the gaps where some data values were invalid or provide footnotes for how calculations were made during periods when data was invalid.
In one final hypothetical example, in production reports prepared from historical data where flowrates are integrated to compute daily productions, gaps may exist where the flowrates were not accurate or out of range. This could result in errors computing the actual production rates. Calculations that fill in missing data with the last good value or ignore data validity would fail an audit.
These are just a few of the issues to consider when mining data for gold. Without accurate and timely data all the analytics in the world wouldn’t provide useful insights or operational intelligence.
ARC has the following recommendations for owner-operators:
The techniques presented here are fundamental for process control and safety systems to function reliably and to gain maximum insights from the associated historical data.
Sessions at the upcoming ARC Industry Forum in Orlando, Florida, Feb. 8-11, 2016 will explore these and related issues.
If you would like to buy this report or obtain information about how to become a client, please Contact Us
Keywords: Data Analytics, Big Data, IIoT, Historian, Data Reconciliation, Real-Time Data, Enterprise Manufacturing Intelligence (EMI), ARC Advisory Group.