Representative End User Clients







Representative Automation Clients







Representative Software Clients








The India IT industry continues its moderate momentum as most of the IT services companies covered in the report  exhibited above-average growth. In this report, we analyze the revenues of India’s IT services sector for the fourth quarter of financial year 2016-17 and compare these with the same period the previous year.
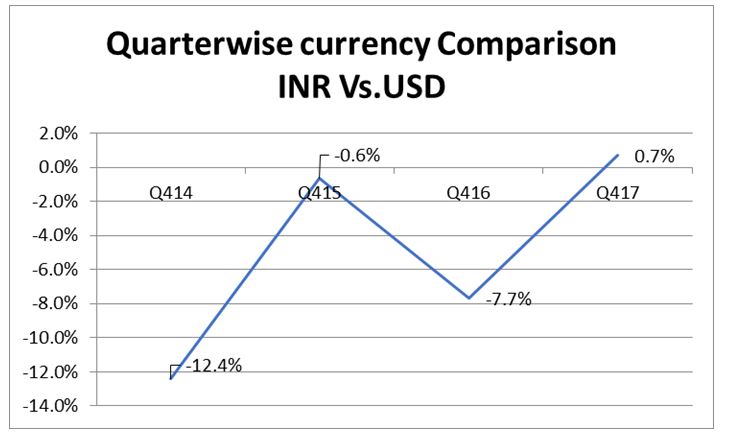
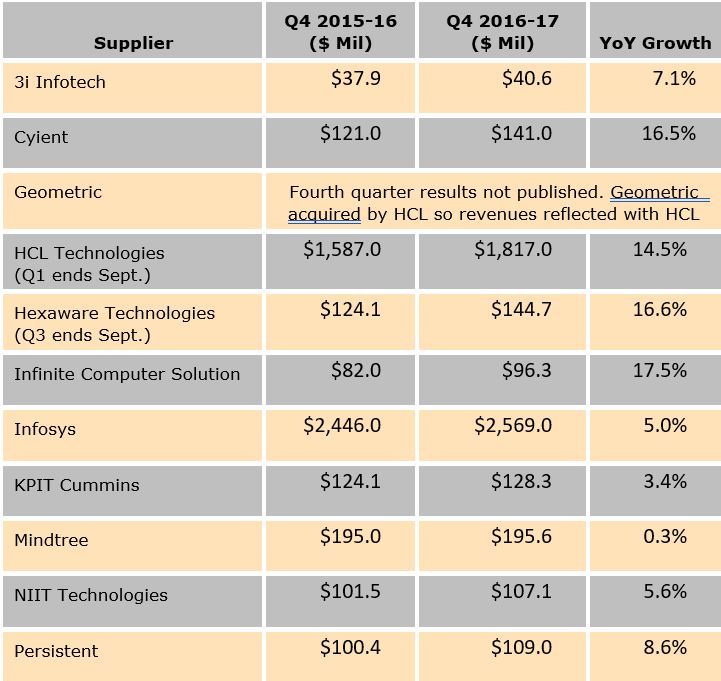
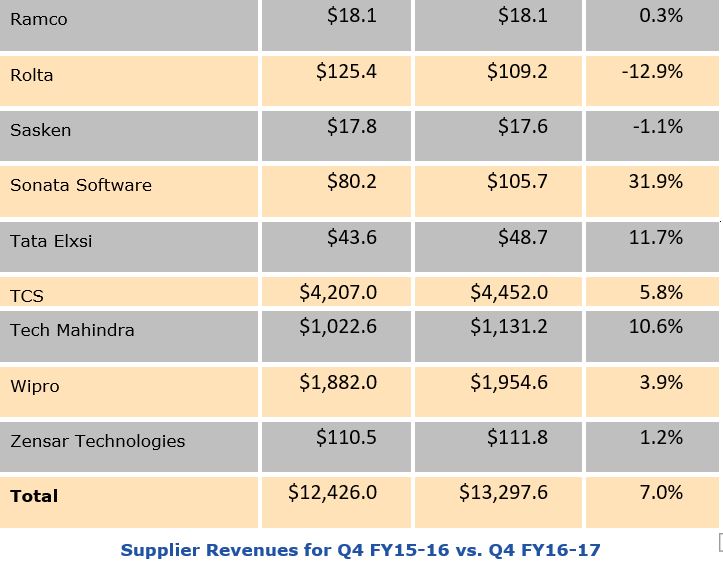
This report discusses the financial results of the top 20 India-based IT companies listed on the National Stock Exchange (NSE), Bombay Stock Exchange (BSE), or both. We believe this provides a representative sample of India’s IT market. The suppliers included in this report recorded combined quarterly revenue of $13.2 billion, representing 7 percent year-over-year growth rate. Only two out of the 20 companies reported a year-over-year decrease in software or product revenues, while the rest showed growth in Q4. The rupee minimally appreciated by 0.7 percent during the quarter compared with the same period last year.
This ARC Advisory Group report discusses the most recent quarterly revenue results of the major publicly traded IT services companies based in India. We translated financials reported in Indian rupees to US dollars using an average exchange rate for the given reporting period. Owing to this translation, some companies may show negative growth. The suppliers’ reporting period for this analysis is the quarter ending in March unless stated otherwise. We have considered the consolidated revenues for all vendors, including subsidiaries’ revenues, except for Wipro, for which we only considered IT products and services.
3i Infotech reported total revenue of $40.6 million for the quarter ending March 31, 2017. This represents a growth of 7.1 percent compared with the same period in the prior year. Ninety-five percent of 3i Infotech’s revenues came from “IT Solutions” (software products & services, software development, consulting, and IT infrastructure services) and the rest from “Transaction Services” (IT-enabled services).
Cyient reported revenue of $141 million for the quarter ending March 31, 2017. The revenues were up by 16.5 percent year over year. Geographically, revenues from the Americas contributed 57.1 percent, EMEA 25.1 percent, while APAC and others contributed 17.8 percent. Cyient organized itself into eight business units effective April 2016. From the business unit perspective, aerospace & defense contributed 35.7 percent; transportation 9.7 percent; industrial, energy & natural resources 8.7 percent; semiconductor 4.2 percent; medical & healthcare 1.9 percent; utilities and geospatial 18.5 percent; and communication contributed 21.4 percent. Industry-wise, revenue was 9.2 percent from aerospace and defense, 20.6 percent from industrial, 9.7 percent from medical, 59.3 percent from communications, and 1.2 percent from others. Cyient added two new clients in this quarter. Total employee strength was 13,732 at the end of Q4. Cyient acquired UK-based geospatial services provider Blom Aerofilms in December 2016.
Geometric: Fourth quarter results not published. As Geometric was acquired by HCL, the revenues are captured in the HCL segment.
HCL Technologies achieved total revenue of $1.8 billion for the fourth quarter, representing a 14.5 percent year-over-year growth rate. Industry application services contributed 36.8 percent, infrastructure services 38.8 percent, business services 3.9 percent, and engineering and R&D services 20.5 percent in Q4. Geographically, 62.6 percent of revenues came from the Americas, 27.7 percent from Europe, and 9.7 percent from the ROW. Vertically, manufacturing contributed 34.6 percent to the company’s growth and financial services 24.2 percent. Life sciences & healthcare contributed 11.5 percent, retail & CPG 9.2 percent, public services contributed 11.7 percent, telecommunications 8.4 percent, and others contributed 0.3 percent. The total employee count in HCL was 115,973 in this quarter.
Hexaware Technologies reported a total of $144.7 million revenues, representing 16.6 percent growth over the same quarter in the prior year. Vertically, banking and financial services (the largest focus vertical for Hexaware) contributed 42.7 percent; manufacturing, consumer, and others 28 percent; healthcare and insurance 15.7 percent; and travel and transportation 13.6 percent. Segment-wise, application development & maintenance (ADM) contributed 36.1 percent to the revenues, enterprise solutions 12.1 percent, quality assurance and testing services (QATS) 20.9 percent, business intelligence & analytics 13.8 percent, business process services (BPS) 6.4 percent, and infrastructure management services (IMS) 10.7 percent. Hexaware’s employee count including trainees during the quarter stood at 12,734. Hexaware added 2 new clients and signed agreement with TCV of $25 million in this quarter.
Infinite Computer Solutions reported total revenue of $96.3 million for the quarter ending March 31, 2017. This represents an increase of 17.5 percent from the same period last year. Vertically, telecom & media contributed 29.4 percent; technology, a major contributor to Infinite revenues, contributed 43.9 percent; healthcare 23.4 percent; BFSI 0.2 percent; and others 3.1 percent. Segment-wise, Technology Solutions contributed 83 percent, mobility 8.2 percent, and product engineering services 8.8 percent. Geographically, US was the major contributor representing 89.1 percent of revenues, India 5.4 percent, APAC 4.8 percent, and Europe 0.7 percent. Total employee strength was at 5001 at the end of Q4.
Infosys reported $2,569 million revenues for the quarter ended March 31, 2017. This represents 5 percent growth over the same period the prior year. Infosys and its subsidiaries added 321 customers during the period. Vertically, 33.2 percent of revenues came from insurance banking and financial services; 22.6 percent from manufacturing & hi-tech; 23.4 percent from retail and life sciences; and 20.8 percent from energy, utilities, and communication and services. By service offering, business IT services contributed 61.9 percent; consulting, package implementation, and others 32.6 percent; and products, platforms, and solutions 5.5 percent. Geographically, 61.9 percent of revenues came from North America, 22.5 percent from Europe, 3.2 percent from India, and 12.4 percent from ROW. Infosys and its subsidiaries had a total headcount of 200,364 employees at the end of this quarter.
KPIT reported revenue of $128.3 million for the quarter ended March 31, 2017. This represents a growth of 3.4 percent year over year. Geographically, the Americas contributed 67.66 percent to KPIT’s Q4 revenues, Europe 16.75 percent, and ROW 15.59 percent. Vertically, automotive and transportation recorded 41.29 percent, manufacturing 33.79 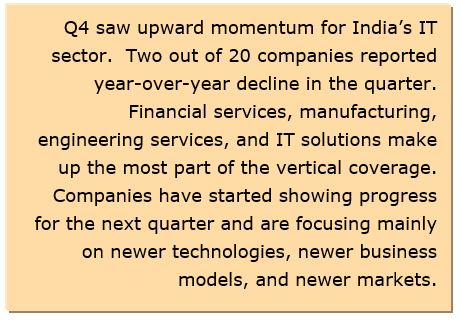 percent, energy and utilities 13.96 percent, and others 10.96 percent. Segment-wise, integrated enterprise solutions represented 27.66 percent of revenues, product auto and engineering services 35.23 percent, products & platforms 4.15 percent, SAP practice 22.72 percent, and digital transformation (enterprise solutions) 10.25 percent. The company added three new customers during the quarter, with total headcount of 12,110 employees at the end of March 31, 2017.
Mindtree reported revenue of $195.6 million for the quarter. This represents 0.3 percent year-over-year growth in revenue. Geographically, 69.8 percent revenues came from the Americas, 20.8 percent from Europe, 2.8 percent from India, and 6.6 percent from ROW. Vertically, 37.5 percent of revenues came from technology, media and services; 24.7 percent from BFSI; 23 percent from retail, CPG, and manufacturing; and 14.9 percent from travel & hospitality. Among service offerings, development contributed 21.4 percent, engineering 9.5 percent, maintenance 18.3 percent, infrastructure and support 20.4 percent, independent testing 12.5 percent, consulting 4 percent, and package implementation 12.6 percent. Finally, IP-led revenue contributed 1.3 percent. The company added 20 new clients and one $100 million client in this quarter. The company’s employee strength was 16,470 at the end of March 31, 2017.
NIIT Technologies reported revenue of $107.1 million for the quarter ended March 31, 2017. This represents a growth of 5.6 percent from the prior year. Geographically, revenues from the Americas contributed 48 percent, EMEA contributed 33 percent, and ROW contributed 19 percent. Vertically, banking and financial services was a major contributor to the revenues with 42 percent; travel & transportation 31 percent; and manufacturing, media, and others 27 percent. Segment split is as follows: application development and management contributed 66 percent, business process outsourcing 5 percent, management services 18 percent, system integration and package implementation 6 percent, and IP assets 6 percent. In Q4, the company added five new customers to its client list – two in the Insurance domain and three in others.
Persistent Systems reported revenue of $109 million for the quarter ended March 31, 2017. This represents 8.6 percent growth compared with the previous year. Services contributed 72.4 percent while the IP-led business contributed 27.6 percent of Persistent’s business. Segment-wise, infrastructure and systems contributed 43.9 percent to the total revenues, digital 18.9 percent, alliance 27.6 percent, and accelerate 9.6 percent. Geography-wise, North America contributed 86.5 percent, Europe 5.3 percent, India 5.6 percent, and ROW 2.6 percent.
Ramco reported revenue of $18.1 million with a marginal growth of 0.3 percent in the fourth quarter. The majority of Ramco’s revenue came from markets outside India. The company recorded a marginal decline in this quarter.
Rolta reported revenue of $109.2 million in Q4, representing a year-over-year decline of 12.9 percent as compared with the same period in the previous year. Segment-wise, 22.9 percent of Rolta’s revenues came from enterprise geospatial & engineering solutions (EGES), while the remaining 77.1 percent came from system integration & enterprise IT Solutions (EITS).
Sasken reported revenue of $17.6 million for the quarter ended March 31, 2017. This represents a slight decrease in revenue of 1.1 percent year over year. Geographically, 32 percent revenues came from North America, 35 percent from EMEA, 27 percent from India, and 6 percent from APAC. Services generated 77 percent of Sasken’s revenues with the rest coming from products. Sasken group had a total headcount of 1,963 in this quarter.
Sonata reported total revenue of $105.7 million for the quarter ended March 31, 2017. This represents a revenue increase of 31.9 percent year over year. Geography-wise, 60 percent of revenues came from North America; 24 percent from Europe, including UK; and 16 percent from ROW. Vertically, 29 percent of revenues came from outsourced product development (OPD); 27 percent from travel transportation and logistics (TTL); 26 percent from retail & CPG; and 18 percent from others. The employee count stood at 3,366 in this quarter.
Tata Elxsi recorded $48.7 million in revenue for the quarter ended March 31, 2017. This represents 11.7 percent growth year over year. Segment-wise, 80.2 percent came from embedded product design, 13.7 percent from industrial design & visualization, and 6.1 percent from system integration & support services.
TCS’ quarterly revenue increased 5.8 percent year over year to $4.4 billion. The company added one new customer in the $100M+ category, four in the $50M+ category, four in the $20M+ category and ten new customers in the $10M+ category in this quarter. North America contributed 53.3 percent and Latin America 2.1 percent. Within Europe, UK contributed 13.7 percent and Continental Europe 11.8 percent. India contributed 6.8 percent, APAC 9.7 percent, and MEA 2.6 percent. Vertically, banking and financial services contributed 40.9 percent, retail & CPG 14.1 percent, telecom 10.8 percent, manufacturing 10.4 percent, hi-tech 5.6 percent, life sciences & healthcare 7.3 percent, energy & utilities 4.1 percent, travel & hospitality 3.7 percent, and other verticals 3.1 percent. Segment-wise, IT solutions and services contributed 65.3 percent (application development & maintenance 39.4 percent, enterprise solutions & consulting 17.1 percent, and assurance services 8.8 percent); infrastructure services 15.2 percent; business process services 11.6 percent; engineering & industrial services 4.7 percent; and asset-leveraged services 3.2 percent. The addition of 8726 employees led to a total headcount of 387,223 at the end of the quarter.
Tech Mahindra reported combined total revenues of $1.1 million for the quarter ended March 31, 2017. This represents 10.6 percent growth from the same period in the previous year. Geographically, the Americas contributed 45.1 percent to Tech Mahindra’s revenues, Europe 29.6 percent, and ROW 25.3 percent. Vertically, communication contributed 46.3 percent of total revenue (making it the largest contributor to Tech Mahindra’s business); manufacturing 18.7 percent; technology, media, and entertainment 6.7 percent; BFSI 12.6 percent; retail, transport, and logistics 6.9 percent; and others 7.2 percent. Total active customers for the company stood at 843. The total headcount of Tech Mahindra is 117,693 at the end of this quarter.
Wipro reported total revenue of $1.9 billion from IT services for the quarter ended March 31, 2017. This represents a 3.9 percent growth from the same period the previous year. The IT services segment had 181,482 employees as of March 31, 2017. Vertically, financial services contributed 26 percent of all IT revenues, manufacturing and technology 22.8 percent, global media and telecom 6.9 percent, energy and utilities 13.1 percent, healthcare & life sciences 15.4 percent, and retail and consumer goods 15.8 percent. Geographically, the Americas contributed 54.9 percent, Europe 24.4 percent, India and Middle East 9.9 percent, with the remaining 10.8 percent coming from APAC and other emerging markets.
Zensar reported total revenue of $111.8 million for the quarter ended March 31, 2017. This represents a slight growth of 1.2 percent from the same period the previous year. Segment-wise, 81.4 percent of revenues came from application management services, 18.6 percent from infrastructure management services, 7.2 percent from maintenance, and 11.4 percent from other services. Geographically, 73.8 percent of revenue came from USA, Europe 13.8 percent, Africa 9 percent, and ROW 3.5 percent. Vertically, manufacturing contributed 52.8 percent, retail & distribution 26.4 percent; insurance, banking, and finance 17.4 percent; and emerging markets 3.3 percent. Zensar added 11 new clients in this quarter. Total employee count stood at 8,524, including the addition of 573 new employees at the end of Q4 2016-2017.
IT companies in India continued their growth path in the fourth quarter of FY16-17. Nearly all the companies covered in the report registered above-average growth rate during this period. Some factors that contributed to this growth include acquisition and development of different business units; adoption of disruptive technology trends like social media, mobility, analytics, and cloud (SMAC); and enhanced focus on newer business models and emerging market segments. Technology trends like Industrial Internet of Things (IIoT), automation-driven services, and virtualization played an important role in the growth of India’s IT industry. ARC believes that the market will continue to grow in the rest of FY17.
If you would like to buy this report or obtain information about how to become a client, please Contact Us
Keywords: IT (Information Technology), IT Services, Quarterly Supplier Revenues, Software Development, Business Process Outsourcing (BPO), ARC Advisory Group.