


This in-depth market data research is split into two key modules: Market Growth Outlook and Competitive Analysis. Each of these modules is further configured into several sub-modules to meet the needs of executives as well as marketing, sales, and product development managers. All of these modules and sub-modules may be purchased as a bundle or separately. A brief description of these modules, sub-modules, and their use cases is included below.
The Total Instrumentation Expenditures for Process Industries Research delivers current market analysis plus a five year market and technology forecast.
Process Control and Efficiency in Instrumentation Market Enhanced by Artificial Intelligence
ARC Advisory Group’s research reveals that the process instrumentation space is undergoing a dynamic phase of growth and transformation, spurred by rising demand for precision and efficiency across a variety of applications. It is evident that AI and digitalization initiatives have emerged as the fulcrum of all businesses. Suppliers are enhancing measurement capabilities and expanding market possibilities. Industry leaders are committed to advancing these technologies to address the unique needs of their clients, ensuring that each solution optimizes performance and safety across diverse environments. The adoption of Industrial IoT and smart sensors is revolutionizing the industry, with wireless technology and multivariable transmitters leading the way. The emergence of Ethernet-APL, which provides better connectivity between field data and enterprise systems, is also contributing to the market's expansion, providing a robust and efficient communication protocol for industrial automation that form the underpinnings of process efficiency and stability.
Instrumentation Expenditures Market Strategic Issues
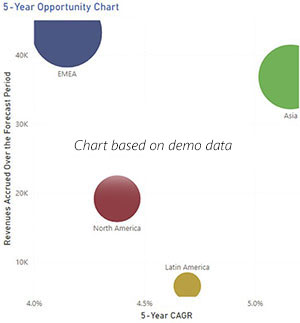 In addition to providing a five-year market forecast, the Total Instrumentation Expenditures for Process market research provides detailed quantitative current market data and addresses key strategic issues as follows.
Prioritize Application Compatibility
Buyers should evaluate the compatibility of capacitance level measurement devices with their specific application needs. These devices vary in sensitivity, probe design, and dielectric handling, making it essential to match the device with the material being measured—whether it's liquid, slurry, or granular solids. For instance, high-dielectric materials may require different calibration than low-dielectric ones. Understanding the process conditions such as temperature, pressure, and tank geometry ensures optimal performance. This strategy minimizes operational errors and enhances measurement accuracy. A thorough application analysis before purchase can prevent costly mismatches.
Ethernet Connectivity for Greater Process Insight
Ethernet connection is generating a lot of interest in both the user and supplier communities. Ethernet offers many benefits—lower total cost of ownership (TCO), improved adaptability, better security, widespread availability, and market familiarity. It offers improved connectivity and functionality, allowing for easier access to measurement information. In recent years, networking technology has also overcome many of its disadvantages that hindered adoption in the industrial world. Using fiber-optic cables, Ethernet can be deployed for longer distances. Ethernet switches for hazardous areas are available and users also have the option of Power over Ethernet (PoE), so there is no need to run additional lines for power supply. In the process world, Ethernet can now connect a wide range of field instruments, including flowmeters, to a central control system.
Utilize Asset Management Features
Plant asset management (PAM) has become an important tool in helping users assess the health of their production assets and processes, and it is instrumental in developing effective predictive maintenance programs and achieving operational excellence. A key enabler of PAM is intelligent field devices with diagnostic capabilities. Although a large number of intelligent field devices have been installed in plants around the world, they are often underutilized. In many cases, the onboard intelligence is only accessed locally via a handheld communicator when a device is commissioned. End users should provide training, education, and support programs to plant staff to realize the benefits that smart field devices offer. End users should work with suppliers to get clear demonstrations of how embedded device diagnostics can help them assess not only the condition of the device, but also the condition of the process.
Market Data Research Available Datasets
Market Growth Outlook
ARC’s market growth outlook service delivers an in-depth market opportunity analysis including five-year market and technology forecasts and 3-year history trend lines where available. Besides providing an in-depth analysis of the market opportunity provided by each technology, this service allows technology suppliers to analyze their own customized markets consisting of multiple technologies. For example, customers can view different market scenarios by adding or removing technology markets from the analysis, providing them a Total Available Market (TAM) view of their own served market. A list of the available market growth outlook services can be seen in the list below.
This service is designed to help accelerate your organization's ability to understand an up-to-date view of the market opportunity provided by your current product portfolio and analyze how your company’s market opportunity would change if you were to acquire or divest a particular product line. The service will also help you identify and capitalize on emerging markets, whether these markets are based on an emerging technology, region, vertical industry, or application. Built upon a proprietary market model and ARC’s field proven primary research, this service helps product and marketing managers optimize their business plans by identifying the opportunities provided by emerging trends. ARC’s reputation as the preeminent independent provider of market growth opportunity analyses for nearly four decades also provides greater weight to your business plans. ARC’s market growth outlook services are available in a variety of formats depending on whether you view your market opportunities via different technologies, industries, or world regions.
In addition, ARC has a strong history of providing customized market opportunity reports and services to meet your specific needs. For example, you may sell your products only to specific industries and/or in only one or two regions. You tell us your served markets and ARC can quickly configure a report or service designed to best serve your served market.
ARC provides several versions of these reports and services depending on your role in the organization. Executive Views are high level market opportunities designed to help executives quickly identify key trends and market opportunities around the world. In-depth market opportunity analyses provide marketing and product managers more detailed technology specific market information to plan marketing and product development strategies. The following table shows more specific information included in each version.
| Market Growth Outlook Analysis | Use Cases | Target Role |
| Worldwide Market Growth Outlook by Industry & Region with 3-year history where available | In-depth technology-specific strategic growth planning across multiple technologies, applications, regions, and industries | Product & Marketing Managers |
| Worldwide Industry Growth Outlook by Region with 3-year history where available | Strategic technology growth planning for markets defined by a single or multiple vertical industries | Industry Managers |
| Regional/Country Market Growth Outlook by Technology & Industry with 3-year history where available (includes country data) | Strategic technology growth planning for markets defined by a single or multiple world regions | Regional & Country Sales Managers |
| Market Growth Outlook Executive View | Strategic Total Available Market (TAM) growth planning dashboard covering multiple vertical industries, technologies, and world regions | Executives |
Market Competitive Analysis
ARC’s Competitive Analysis services deliver in depth competitive analyses across multiple technologies, applications, regions, and industries. Besides providing an in-depth analysis of the market opportunity provided by each technology, this service allows technology suppliers to analyze their own customized markets consisting of multiple technologies. For example, customers can view different market scenarios by adding or removing technology markets from the analysis, providing them a Total Available Market (TAM) view of their own served market. A list of the available market growth outlook services can be seen in the list below.
This service is designed to help product and marketing managers identify their company’s market positioning across multiple views within their Serviceable Available Market (SAM). Built upon a proprietary market model and ARC’s field proven primary research, this service helps product and marketing managers optimize their business plans by identifying how their company’s market position would change if the company were to acquire or divest a particular product line or technology. ARC’s reputation as the preeminent independent provider of competitive market benchmarking for nearly four decades lends greater weight to your business plans. ARC’s market competitive services are available in a variety of formats depending on whether you view your market opportunities via different technologies, industries, or world regions.
In addition, ARC has a strong history of providing customized market opportunity reports and services to meet the specific needs of our clients. For example, you may sell your products only to specific industries and/or in only one or two regions. You tell us your served markets and ARC can quickly configure a report or service designed to best serve your served market.
ARC provides several versions of these reports and services depending on your role in the organization. Executive Views are high level market competitive analyses designed to help executives quickly assess their SAM by world region, technology, or vertical industry. In-depth competitive market analyses provide marketing and product managers more detailed technology specific benchmarking information to plan marketing and product development strategies. The following table shows more specific information included in each version.
| Competitive Analysis | Use Cases | Target Role |
| Worldwide Competitive Analysis by Technology | In-depth competitive market analysis that quantifies how your company’s market position has changed over time across multiple technologies, applications, regions, and industries | Product & Marketing Managers |
| Worldwide Competitive Analysis by Industry | Strategic technology-based competitive analyses for markets defined by a single or multiple vertical industries | Industry Managers |
| Regional/Country Competitive Analysis by Industry | Strategic technology-based competitive analyses for markets defined by a single or multiple world regions | Regional Sales Managers |
| Competitive Analysis Executive View | Strategic Serviceable Available Market (SAM) analysis dashboard covering multiple vertical industries, technologies, and world regions | Executives |
Worldwide Research Focus Areas
Worldwide Research Focus Areas
Strategic Analysis
- Major Trends
- Executive Overview
- Buyer Strategies
- Supplier Strategies
- Growth Contributors and Inhibitors
Competitive Analysis
- Market Shares of the Leading Suppliers
- Market Shares by Region
- North America
- Europe, Middle East, Africa
- Asia
- Latin America
- Market Shares by Industry
- Cement & Glass
- Chemical
- Electric Power Generation
- Food & Beverage
- Marine
- Metals
- Mining
- Oil & Gas
- Pharmaceutical & Biotech
- Pulp & Paper
- Refining
- Water & Wastewater
- Market Shares by Product
- Capacitance Level Devices
- Continuous Ultrasonic Level Devices
- Coriolis Flowmeters
- Hydrostatic Level Devices
- Magnetic Flowmeters
- Pressure Transmitters
- Radar Level Devices
- Temperature Transmitters
- Ultrasonic Flowmeters
- Vortex Flowmeters
Market Forecasts
- Total Instrumentation Expenditures for Process Industries
- Shipments by Region
- North America
- Europe, Middle East, Africa
- Asia
- Latin America
- Shipments by Industry
- Cement & Glass
- Chemical
- Electric Power Generation
- Food & Beverage
- Marine
- Metals
- Mining
- Oil & Gas
- Pharmaceutical & Biotech
- Pulp & Paper
- Refining
- Water & Wastewaterr
- Shipments by Product
- Capacitance Level Devices
- Continuous Ultrasonic Level Devices
- Coriolis Flowmeters
- Hydrostatic Level Devices
- Magnetic Flowmeters
- Pressure Transmitters
- Radar Level Devices
- Temperature Transmitters
- Ultrasonic Flowmeters
- Vortex Flowmeters
Industry Participants
The research identifies all relevant suppliers serving this market.
For More Information
To speak with the author or to purchase the Total Instrumentation Expenditures for Process Industries Market Research, please contact us.
Learn more about ARC In-depth Research at Market Data Services
Learn more about ARC Strategic Services at Advisory Services for Industry Leaders