Representative End User Clients


Representative Automation Clients
Representative Software Clients


Internet-driven technologies have transformed the way manufacturers and processors consume information. PCs, tablets and  smartphones have led to multiple options for visualization while democratizing the dissemination of information. Smart devices and automation embedded close to the process, including edge devices, gather and analyze data and convert it into meaningful information. HMI/SCADA systems and other process management applications aid interpretation and control of the processes and assets they oversee. However, over time the quantity of data from both process and associated systems has increased and new data consumers at the enterprise have emerged introducing the requirement to converge different types of information to generate new insights.
The challenge is how to structure and contextualize information to get only what is needed to the right person at the right time, regardless of where they are located. One way to accomplish this is to employ advanced data visualization technologies that span from HMI/SCADA solutions for the plant or field assets to enterprise solutions for monitoring and managing operations globally. This has led to a new category of solutions that ARC refers to as Enterprise Visualization Interface (EVI) solutions. Industrial software providers, such as AVEVA, offer a full range of EVI solutions designed to not only ensure that the required information is disseminated to the right person at the right time regardless of location, but that the information provides everyone throughout the Enterprise with a single version of the truth.
 Over the years, many manufacturers and processors have used standard tools that display real-time information on their HMI/SCADA screens and historical data funneled into static reports using tables and charts. However, with the convergence of information technology (IT), operations technology (OT) and engineering technology (ET), and with digital transformation accelerating, more sophisticated data visualization tools must be added to display more diverse information surrounding the process throughout the enterprise in ways that allow for faster interpretation and better decision-making.
These tools must support “on-the-spot” data and information analysis leveraging complex analytics and provide a presentation format that delivers the highest user comprehension while allowing selections in real-time of whether the information visualized is from the process, production management, or other associated information sources. This has led to the creation of a whole new category of tools known as Enterprise Visualization Interface (EVI) solutions that can consume multiple types of information structured into a complete view.
IT/OT/ET convergence and digital transformation are bringing OT personnel into the world of IT. New teams comprised of all groups are being tasked with creating an application capable of taking advantage of modern devices and the massive amount of information collected from processes to enhance agility and make greater use of data. However, the challenge is how can IT data be merged with OT data into a form that both makes sense and is easier to maintain than a custom-built application. This is also influenced by data democratization, which is the process of making data accessible to the average non-technical user without having to involve the IT department. Today, industrial companies are borrowing IT approaches and architectures developed for enterprise systems with a focus on speed and scale and combining them with OT data practices and process-centric viewpoints. These next generation of solutions employ tools to help assist IT and OT personnel in accessing the data they seek to solve problems without retraining or adding data science capabilities to industrial organizations. This data democratization is another driver for the emergence of Enterprise Visualization Interface (EVI) solutions.
 One key differentiator of Enterprise Visualization Interface solutions is the ability to exchange data with any application and shape it into a higher-level view. For example, an operator may report a problem with a machine on an HMI terminal. This generates a work order in a field service maintenance (FSM) application, which then requests and bundles relevant information, such as machine parameters, as well as simplified CAD drawings to help guide field service personnel in addition to standard instructions on how to locate and repair the problem.
While this occurs, the Enterprise Visualization Interface solution aggregates this information at the enterprise where decision-makers can evaluate the production impact this problem will have, how long it will take to resolve, redirect resources or production requests to other work cells and monitor the resolution’s progress. Further, because these systems are detached from the point of operation, Enterprise Visualization Interface solutions will be both on-premises and cloud enabled – unlocking the ability to consume and aggregate data from anywhere.
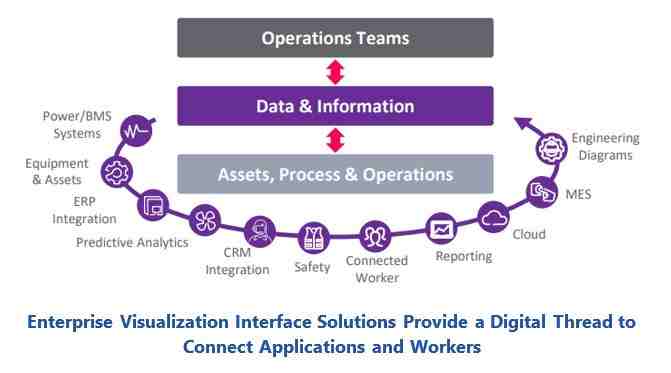
Enterprise Visualization Interface solutions are critical to expediting decisions and increasing the overall agility of a manufacturer or process organization. However, to accomplish this, these systems rely on digital threads connecting assets, data, devices, people, and locations together into a common data structure. The more digital threads that exist, the more insights and uncovered value can be achieved.
Enterprise Visualization Interface solutions help to enhance the value of existing software tools by extending the digital thread through applications, such as asset performance management (APM), up to the enterprise, providing automated guidance for maintenance tasks at a global level. This is a much more sophisticated solution that thanks to the digital thread combines information from multiple sources to put together a simple, yet effective “picture” of the task to be completed. A single maintenance task may require the juxtaposition of images from digital twins, PLM, production management, MES, current process parameters, historical machine information, APM and specific work instructions, leveraging technologies, such as augmented reality (AR), all of which are amplified using Enterprise Visualization Interface solutions.
Enterprise Visualization Interface solutions are designed to provide a high-level perspective of consolidated content containing enriched data in context. They enable a connected workforce that creates an operating environment for better decision-making. The solutions can relate disparate data sources and systems in context to each other, which reduces the effort required to identify insights between applications and data types and provides actionable information to operations teams.

There are often questions regarding what applications the various visualization solutions, such as basic HMI/SCADA, advanced HMI/SCADA, and Enterprise Visualization, are best suited for. HMI/SCADA remains best suited for operations and maintenance personnel, supervisory or direct control functionalities utilizing process (PID) graphics, and visualization of unit, site, and regional operations supporting a more limited number of users. Enterprise
Visualization is best suited for corporate C-level executives, DT, IT across the enterprise and supply chain partners, and middle management teams, used for the visualization and management of manufacturing, maintenance, and financial operations where users can range into the hundreds or thousands. HMI/SCADA is more suited to acquiring data via I/O and connected devices, be part of an OT network, and have a visualization focus of primarily OT applications close to the process. Enterprise Visualization is more adept at getting data via IT data points and sources, be part of IT networks connected to data centers and the cloud, visualizing a balance between IT and OT applications along with some ET applications, and often using operations information management or the enterprise historian as an OT source of information.
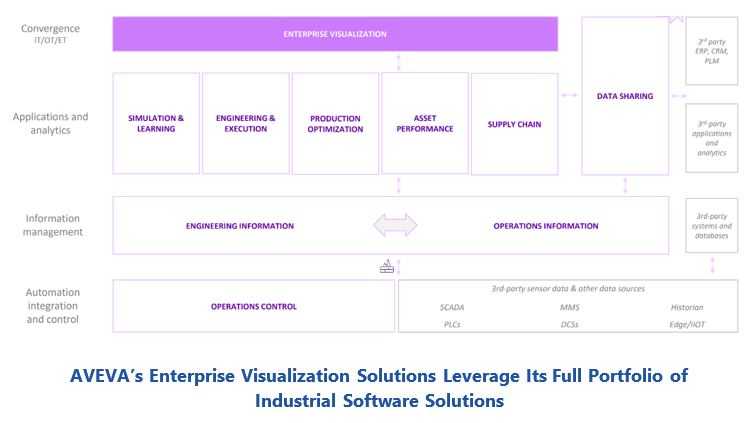
AVEVA, which provides a full portfolio of software solutions ranging from engineering to operations to maintenance, also has an Enterprise Visualization Interface solution adjustable for different use cases, which can seamlessly connect to both third-party 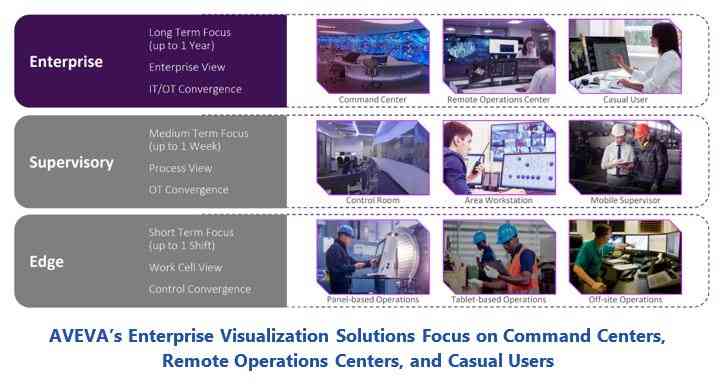 applications and their entire software portfolio. AVEVA’s Enterprise Visualization solutions are designed to take a high-level perspective, focused on consolidating content, providing enriched data in context, enabling a connected workforce, and creating an optimum operating environment for decisions. It is designed to provide a wide range of information in context to operations that spans maintenance, AI/ML, engineering, 3D modeling, and financial and business systems with capabilities in operations control, data management, and management of both instrumented and non-instrumented assets.
AVEVA’s Enterprise Visualization solutions are designed to focus on three areas, but adaptable for many use cases. The first, command centers, where the software provides, for example, large, structured teams in a centralized operations facility with a comprehensive view of the supply chain from end-to-end that helps to optimize operational activities on a macro-level either regionally or globally. The next, remote operations centers, where the software is focused on subject matter experts where, for example, experienced groups are being tasked with driving performance, coordinating operations, or responding to issues that are escalated by site-based personnel or automated notification systems. Finally, the software is designed for business users and individuals who, for example, are executive and strategic analysts emphasizing independent interaction and analysis of operations activities, KPIs, and associated information for decision support.
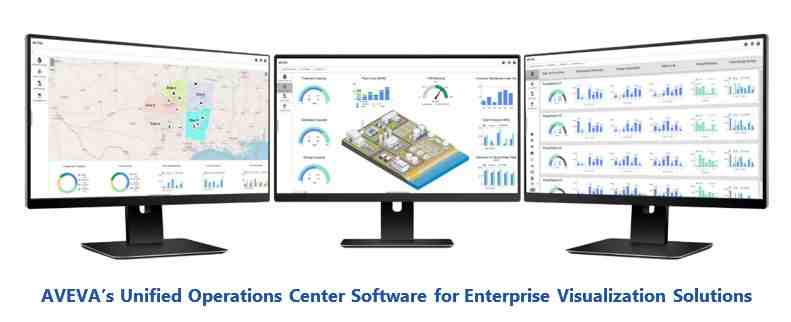
AVEVA’s Enterprise Visualization solutions are all designed to provide the user with intelligence from a high-level perspective. They enable users to drill down by the site to individual assets using hierarchical navigation and intuitive visualization, with detailed operational analysis to help maximize efficiency and ensure resource availability. It can merge data types to understand the deeper context between various aspects of operations, while providing a holistic view of impacts if there are either upstream and downstream operational disruptions or outages. Finally, it provides real-time visibility to critical events as they occur, helping to improve responsiveness while taking a more innovative approach to alarm and event management, emphasizing actionable alerts. To accomplish this, AVEVA provides their Unified Operations Center software for enterprise visualization, designed to offer end-to-end enterprise visibility across engineering and operations with enhanced layers of intelligence that helps to ensure data works in service of organizational goals.
There are several industry examples of AVEVA Unified Operations Center. In water applications, it manages geographically dispersed operations holistically and by individual site from anywhere securely, enriching data for actionable process insights such as asset failure, ensuring water quality and compliance and optimizing operations for energy, chemicals, and cost reduction. In manufacturing applications, it tracks all aspects of production from source to distribution, helping to ensure that manufacturing schedules are on target to meet market demand, aligning all areas of the business to clearer and more concise KPI-based objectives.
In mining applications, it helps to optimize production processes and product inventory positions across the value chain, identifying and recovering from operational deviations and production anomalies while evaluating asset performance and equipment health to help minimize losses and prevent disruptions. And in oil and gas applications, it helps to drilldown and analyze individual value chains from end to end, providing a 360-degree view of asset reliability and availability, centralizing the most knowledgeable people into a single operations environment that can help contribute to bottom line profitability.
There are also several examples of AVEVA Unified Operations Center outside of manufacturing, such as in global data centers, where it takes a multi-layer operations view, drilling-down into sub-systems such as optimizing HVAC to energy efficiency, integration to electrical, mechanical, data hall, fire safety, security, and building automation. For renewables applications, it tracks performance data from all sites and drills down to individual assets, providing greater context between real-time generation and storage, demand and weather impacts. For smart city applications, it digitally connects municipal assets, operations, and people across city services, helping to bridge data silos between distinct systems from transportation to buildings to emergency response.
The need to accelerate digital transformation and IT/OT/ET initiatives, maintain supply chain visibility in real-time, be sustainable and  operationally resilient, meet ESG goals, and still profitably fulfil production schedules create continuous challenges for manufacturers and processors alike. Managing these challenges requires a level of enterprise visibility that is agile and highly collaborative, enables real-time decision support, and provides a single version of the truth across all operations.
This has led to the creation of Enterprise Visibility Interface solutions, which are designed to help everyone have a clear understanding of what is occurring from the field or plant floor up to the C-level and make decisions in real-time that optimize business and operations performance. Organizations pursuing digital transformation should consider focusing on deploying Enterprise Visualization Interface (EVI) solutions to drive greater visibility and context. This means utilizing solutions, such as AVEVA’s Unified Operations Center software for enterprise visualization, which provides seamless connectivity and visibility ranging from engineering to operations to maintenance, enabling companies to fully leverage the benefits of their digital transformation and data convergence journey.
ARC Advisory Group clients can view the complete report at ARC Client Portal
If you would like to buy this report or obtain information about how to become a client, please Contact Us
Keywords: Enterprise Visualization Interface, EVI, Digital Transformation, Data, Information, HMI/SCADA, IT/OT/ET Convergence, Analytics, MES, FSM, ARC Advisory Group.