Representative End User Clients







Representative Automation Clients







Representative Software Clients








ARC Advisory Group had the opportunity to discuss optimization-related technologies for process operations with a manager at a major agricultural, food, and crop processing company with a large animal feed production group. The company has more than 700 grain procurement and/or  processing facilities around the world. Its global footprint includes an extensive connected global transportation network.
This particular manager’s responsibilities span technologies, such as instrumentation, process information systems, and process control. His group takes a proactive role in rolling out leading edge technologies, such as operational intelligence, operational analytics, and operations management.
The manager noted that, like at other manufacturing facilities, there are a number of possible applications for which the company could apply analytics to improve operations. “So what types of analytics should be applied and where should we apply it?” he asked rhetorically. As ARC has discussed in several recent client reports, the oft-used term “analytics,” has a broad meaning and can be confusing. re are many different types of analytics. According to this particular manager, “operational analytics” means applying analytics in real time to operations in manufacturing or processing operations.
The manager described one of the company’s bioprocessing plants that makes different amino acids and other products from fermentation processes. One product, lysine, is produced from a bacterial fermentation and used as an additive for swine, poultry, and other animal feeds. It is a high-volume, low-margin product. Because of the biological nature of the process and the number of the complex variables involved, there can be a lot of process variation. The company needed to implement appropriate technology to reduce variations to make its lysine production more profitable.
The company wanted to be able to use analytics powered by artificial intelligence to optimize its lysine production. The time component is critical, but this can vary quite a bit depending upon process conditions and the individual operators. A lysine batch can take between 60 to 80 hours to complete. To reduce the time actually required, the company wanted to be able to provide the operator with the decision support he or she needed to determine the optimum end point for individual batches based on operating conditions and accumulated experience.
Previously, the company had been using the more traditional method of model predictive control (MPC) to determine the behavior of their fermentation processes. The manager explained the differences between model predictive control and automated analytics, as he understands it.
Model predictive control is a well-established methodology used in the process industries. The people who develop and validate the model are process experts who understand process changes, the variables involved, and interactions. MPC is based on predictions for a fixed time horizon that uses a single set of linear models. Manual analysis of alternative models is generally a manual iterative process that can be tedious and time consuming, and performed by someone with strong process knowledge or even a team of process experts and data scientists. The main issue is that the model needs to change with the data. If the data drifts or something changes, which is the nature of biological processes, the model needs to be re-evaluated or re-built to accommodate new constraints. The model needs to be updated as the process changes and new constraints added.

As we learned, with automated analytics powered by artificial intelligence – predictions are based on any relevant data input that is measured in the process. Non-linear models are not a problem. What’s more, the predictive data model is updated automatically; the analytics platform can analyze many different models and select the best fit. As new data is generated, the predictive model learns and becomes smarter with each new data point. This allows the model to achieve a high level of accuracy at all times.
As the manager explained, to predict the behavior of the fermentation process, the company’s team created a predictive data model using the Canvas Analytics Platform. According to the manager, the OSIsoft PI System provides the foundation for the solution architecture. The company collects, aggregates, and contextualizes all its process data using the 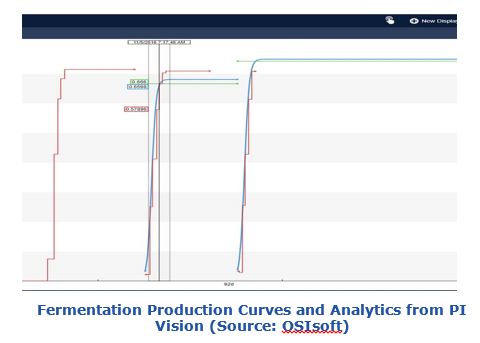 OSIsoft PI System. The company’s team uses the OSIsoft PI Integrator to collect time series asset data and transform it into a relational format consumable by various analytics packages.
The company then worked with the Canvass Platform to create a data model that would predict the behavior of the fermentation. It did so using the data it was already collecting in the OSIsoft PI System. From there, the Canvass Platform generates predictions about how much lysine is produced over one-, two-, three-, and four-hour future increments. The output from those predictions is fed back into the PI System as future data.
Biological processes are complex, variable, and can be difficult to model. Being able to accurately model and determine the end point for each batch can be challenging. The operator must be able to visualize and understand what’s going on quickly and take the appropriate actions. To this end, the company wanted to make the visualization more straightforward and easier to understand for the operators.
The company used the OSIsoft PI Vision dashboard to illustrate the actual vs. predicted data trends. In the past, before, using MPC, the actual lysine production line would increase, reach a certain level, and then level off. The operator would look at the process and determine when the fermentation could be stopped based on his or her individual process knowledge and expertise. But now, by applying automated analytics powered by artificial intelligence, instead of letting the fermenter run too long, the operator uses the analytics to predict when the fermentation is complete. The operator can then stop the process rather than waiting another four or five hours to complete (”just to be sure”) as was done in the past.
To estimate the value achieved with this solution, the team plotted lysine produced in each batch vs. how much time the batch took to complete. The manager noted significant production variability.
By applying predictive models to this application, he expects to get better information to the operator in real time by replicating good batches or good behavior more of the time, reducing process variability, and shifting production yield averages in a more profitable direction.
Based on this data, the company estimated that the technologies should enable a 5 percent increase in productivity or asset utilization, which will increase both margins and profits. The company regularly adjusts its lysine production to match current market demand. By being able to produce the needed amount of lysine with fewer batches, the company will be better positioned to take advantage of market opportunities, while reducing costs. The company believes that by enabling it to apply automated analytics to its data, this solution can save it many thousands of dollars per year.
The manager also indicated that the company is exploring several other areas in which this automated predictive analytics solution could yield additional benefits. These include predictive maintenance, inferential sensors, yield improvements, and asset utilization.
Due, in part to advances in data infrastructures and predictive analytics, ARC observes that use of artificial intelligence and advanced analytic technologies is growing rapidly. The right data infrastructure in place for managing, contextualizing, and connecting the data, combined with the right AI-enabled analytics technology, can provide an industrial organization with a competitive advantage. But only if that organization can also support a data science culture from the top down starting with the data infrastructure.
ARC recommends that companies with complex and/or dynamic processes explore the potential benefits of utilizing predictive (or other) analytics to improve production. When implementing such a solution:
Begin with a data infrastructure that allows users to connect, store and access the data easily
Choose analytics tools from suppliers with demonstrated experience with the application and infrastructure
Make sure the analytics tool is easy to apply
Ensure process data visualization is available for the right workers
Measure the value obtained from the technology
ARC believes that the technology can be applied to many other processes, particularly other inherently dynamic biological processes used in the pharmaceutical, biotech, and brewing industries.
ARC Advisory Group clients can view the complete report at ARC Client Portal on Office 365 or Box.com or New Client Portal on this website
If you would like to buy this report or obtain information about how to become a client, please Contact Us
Keywords: Fermentation End Point, Fermenters, Bioreactors, Artificial Intelligence, Predictive Analytics, Optimization, Biotech, OSIsoft, Canvass Analytics, ARC Advisory Group.